Co-Benefits of Climate Action
Integrated planning and sustainability strategies can yield benefits for both climate adaptation and mitigation than through siloed approaches (Shaw et al., 2014). This requires understanding the inter-relationships and synergies between community development practices and climate innovations can result in co-benefits, i.e., benefits that are often unanticipated and unplanned that enhance another sustainability outcome. In the first phase of our climate change research, we created a map that shows some of these climate action co-benefits, revealing the complementary nature between climate innovation and other actions that contribute to more sustainable development pathways.
In the second phase of our research, we explored the relationships between climate action co-benefits and integrated community planning in greater detail. We developed models of these relationships, particularly focusing on energy innovation, densification, mixed-use development, downtown revitalization, buildings, ecological capital, transportation, waste and water.
To explore our models, click here.
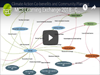
The map below illustrates how engaging in climate action can yield community benefits that extend beyond mitigation and adaptation. There are three types of nodes in the map, which represent action, innovation, and benefits. The blue node in the centre represents climate action, both mitigation and adaptation. The green nodes represent climate innovations. The orange nodes represent co-benefits of the climate innovations that contribute toward some other aspect of community development.
The relationships between the nodes are illustrated through connecting lines, and three types of connections can be found within this map. The blue connections represent how the innovations contribute to climate action. The green connections show how climate innovation can lead to various co-benefits . The orange connections illustrate the relationships and interdependence between the different co-benefits.
NAVIGATING THE MAP
When you click on a node, a description of how it fits within the larger map will appear. Each description contains notes on how a node is connected to other nodes, and references are included to justify the connections. The climate innovations (i.e., green nodes) descriptions provide information on the connections/relationships between the strategies and climate action (i.e., the blue node). The co-benefits (i.e., orange nodes) descriptions will provide information on how the climate innovations can lead to co-benefits, and also how they are connected to other community benefits.
Connections labels appear when you zoom into the map, using the '+' and '-' buttons or the mouse. Click and drag the map to move around and focus on different connections and nodes. As with the nodes, notes associated with connections will appear when you click on them. To collapse descriptions for both connections and nodes to just display the map, click anywhere on the black space of the map.
Climate strategies with co-benefits can result in 'win-win' situations, and thus improve practices for integrated community planning. However, this planning approach also presents challenges because some co-benefit strategies may have associated barriers and/or trade-offs. To better understand both the synergies and challenges of community mitigation and adaptation, we engaged in a research project that examined relationships between climate action strategies, benefits, barriers and trade-offs. The research analyzed data on climate action efforts occurring in eleven BC communities (collected through the MC3 project), and based on this analysis, developed a series of systems models that each center on a particular area of climate action. Together, these models provide a comprehensive impression of the advantages and disadvantages associated with different plans and strategies, and in turn, this insight can be used to inform integrated community planning and decision-making.
Click here to read our paper on how these models were created and how they can be used.
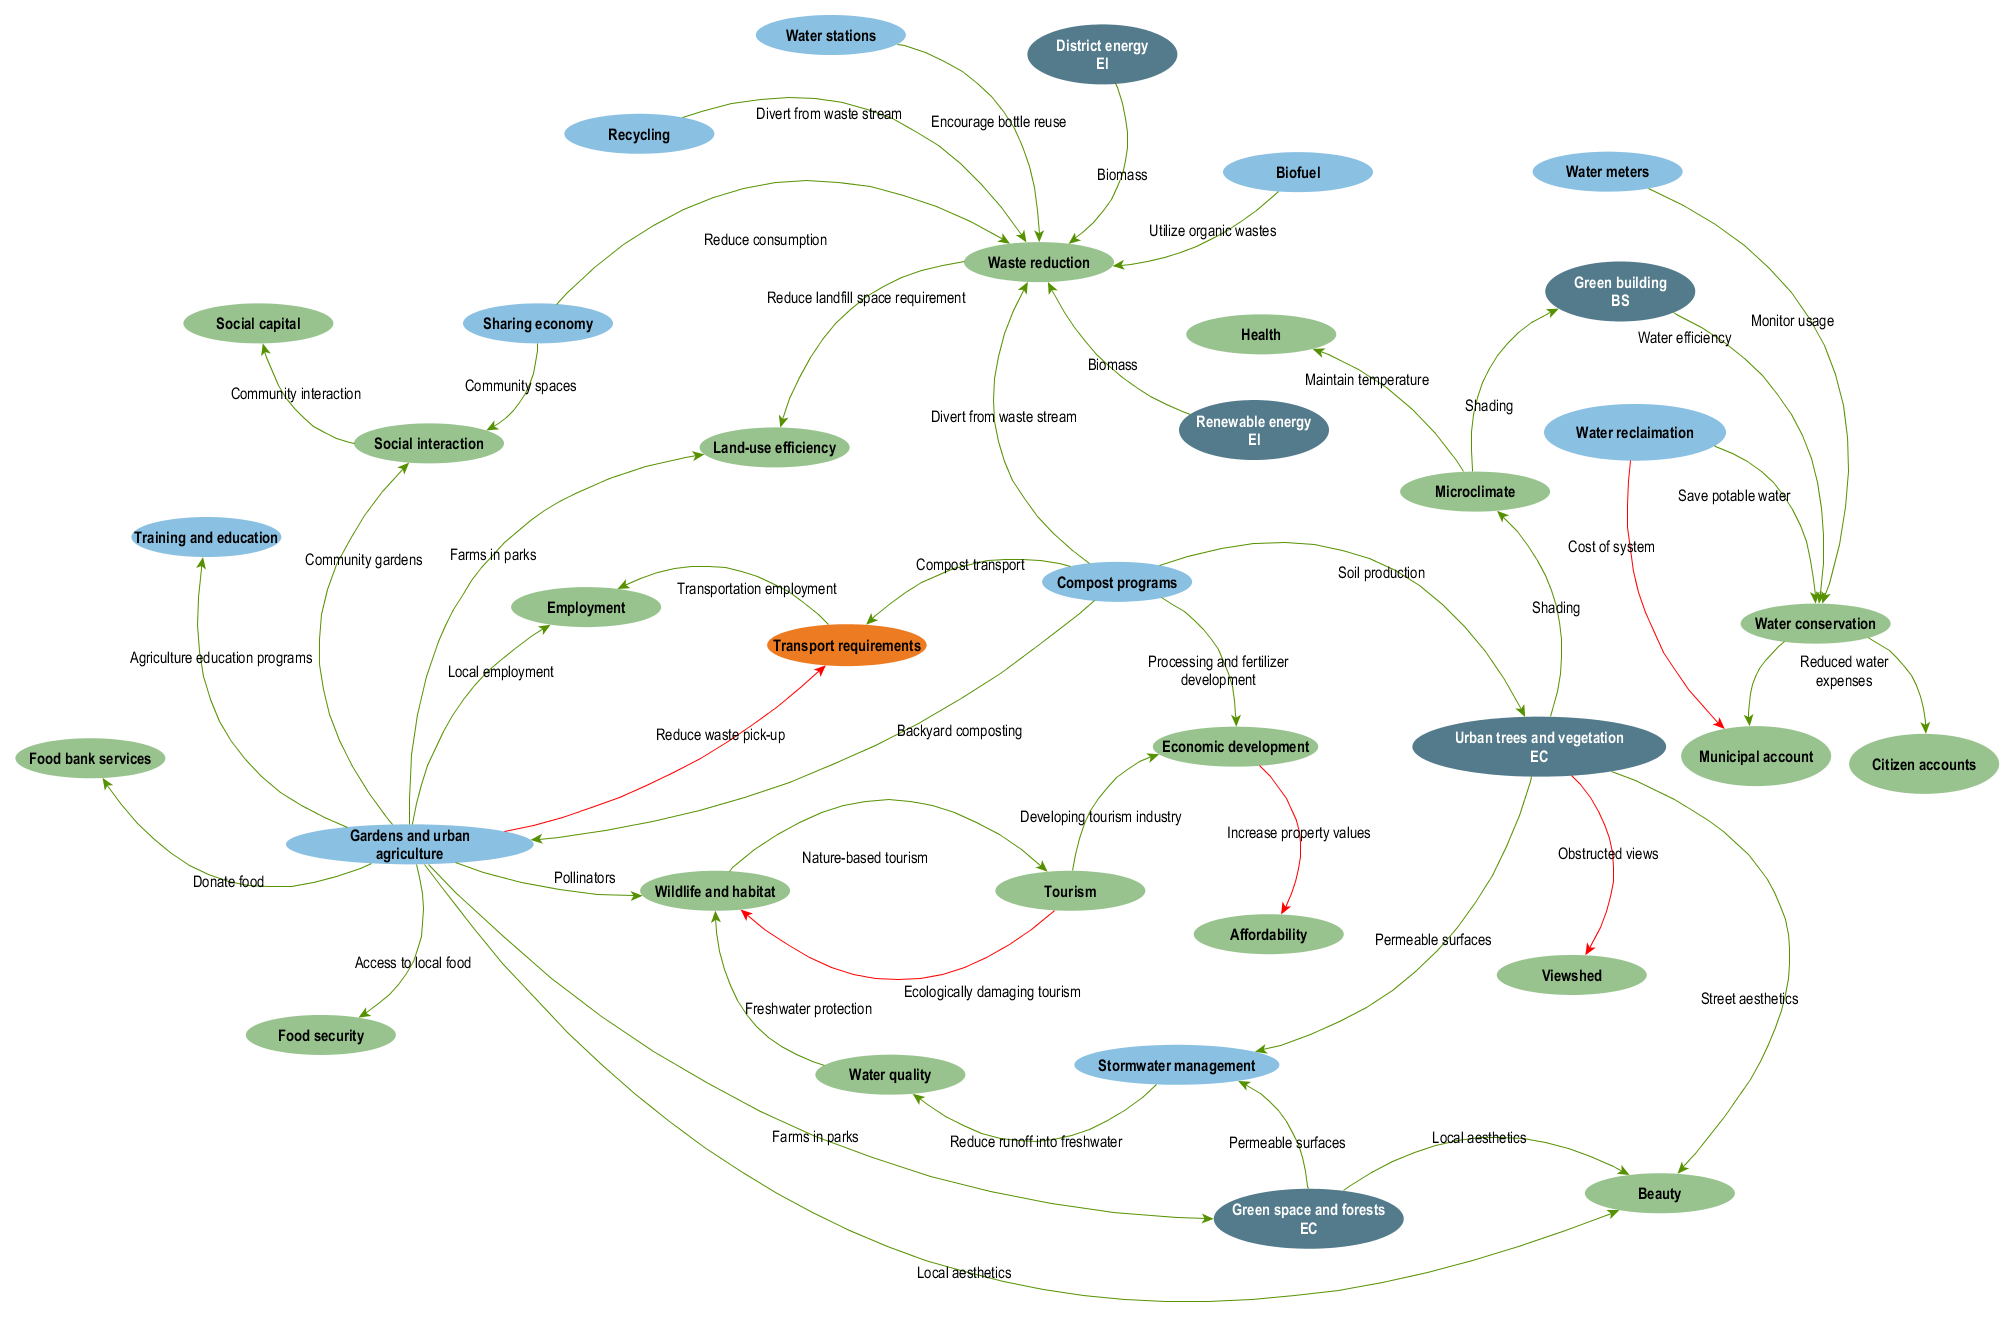
READING THE MODELS
The light blue nodes in the models represent climate action strategies, the green nodes represent benefits, and the orange nodes represent problems (i.e., trade-offs, barriers or challenges). Dark blue nodes represent strategies that link to other models, and the initials displayed on these nodes refer to the following: EI – energy innovation; UD – urban densification; MD – Mixed-used and downtown revitalization; BS – building stock; EC – ecological capital; TT – trails and transportation; WW – waste and water.
Relationships were classified as either positive (green) or negative (red) depending on whether an effect was observed to be enhancing/promoting or diminishing/counteracting, respectively speaking. A strategy that is positively related to a benefit represents one that results in co-benefits, whereas a strategy that is positively related to a problem is one with associated challenges or trade-offs. A problem that is negatively to a benefit represents a challenge/barrier that could diminish or prevent a benefit, whereas a strategy that is negatively related to a problem represents a strategy overcoming or reducing a problem.
DOWNLOADING THE MODELS
The co-benefits models can be downloaded from the table below. Click on the thumbnail images to preview the models, and click the Model image (png) links to download image files of the models. If you would like to use, alter and/or further develop any of the model's for educational, research or planning purposes, click the Working project (graphml) links to download an editable version of the model. The models were created using yEd Graph Editor, which is a free program that can be downloaded here.
| Model | Climate action description | Downloads | |
| Energy innovation | Climate mitigation strategies focused on transitioning from fossil fuels to green energy sources (e.g., renewable energy, district energy) | 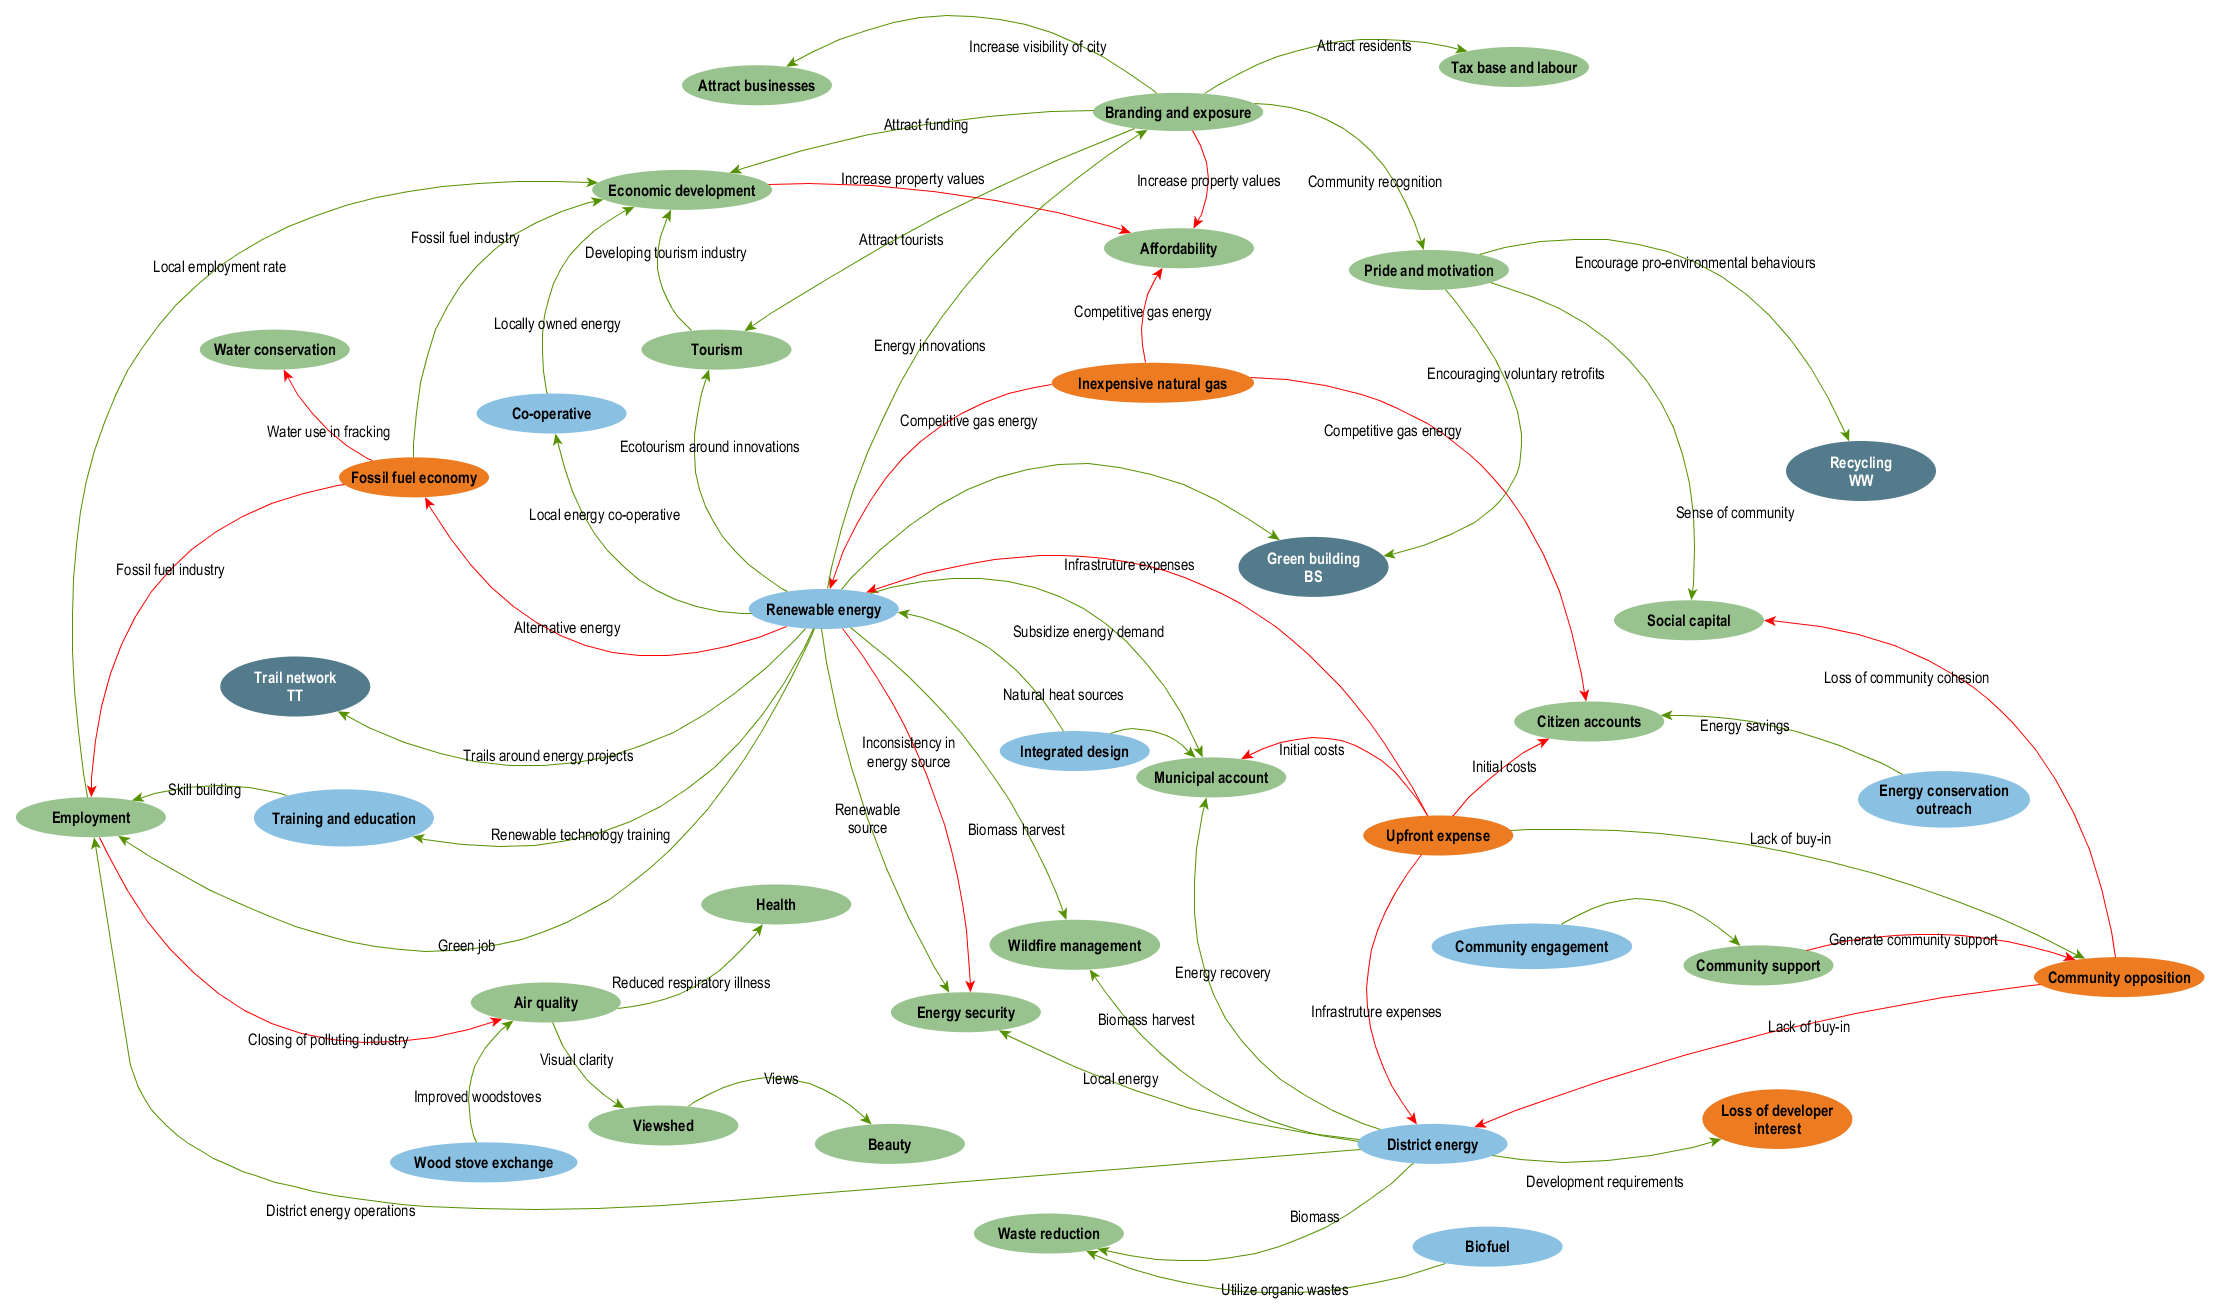 |
|
| Densification | Climate mitigation experienced through efficiencies experienced with transportation and residential energy usage in areas of urban density | 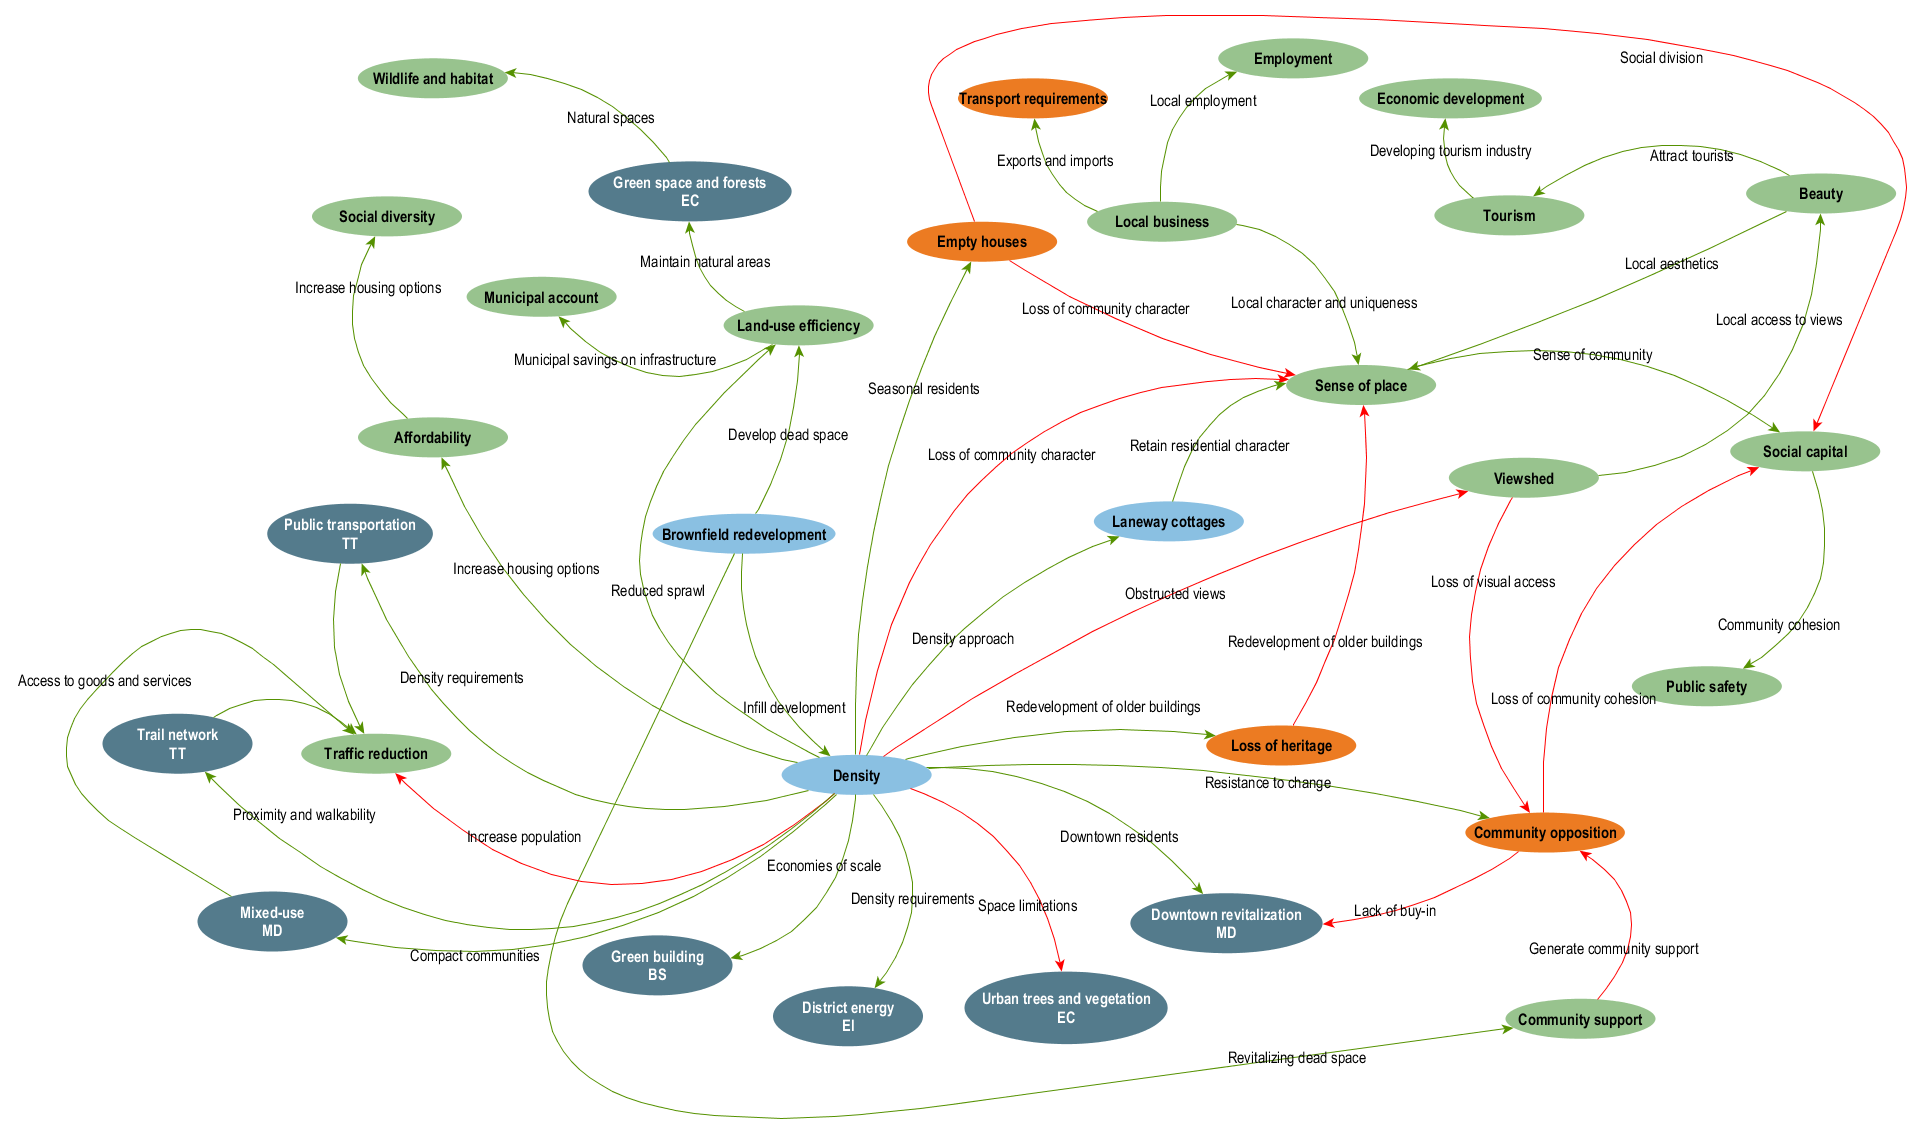 |
|
| Mixed-use and downtown revitalization | Climate mitigation experienced through encouraging active transportation (similar to urban densification, but refers to composition rather than concentration) | 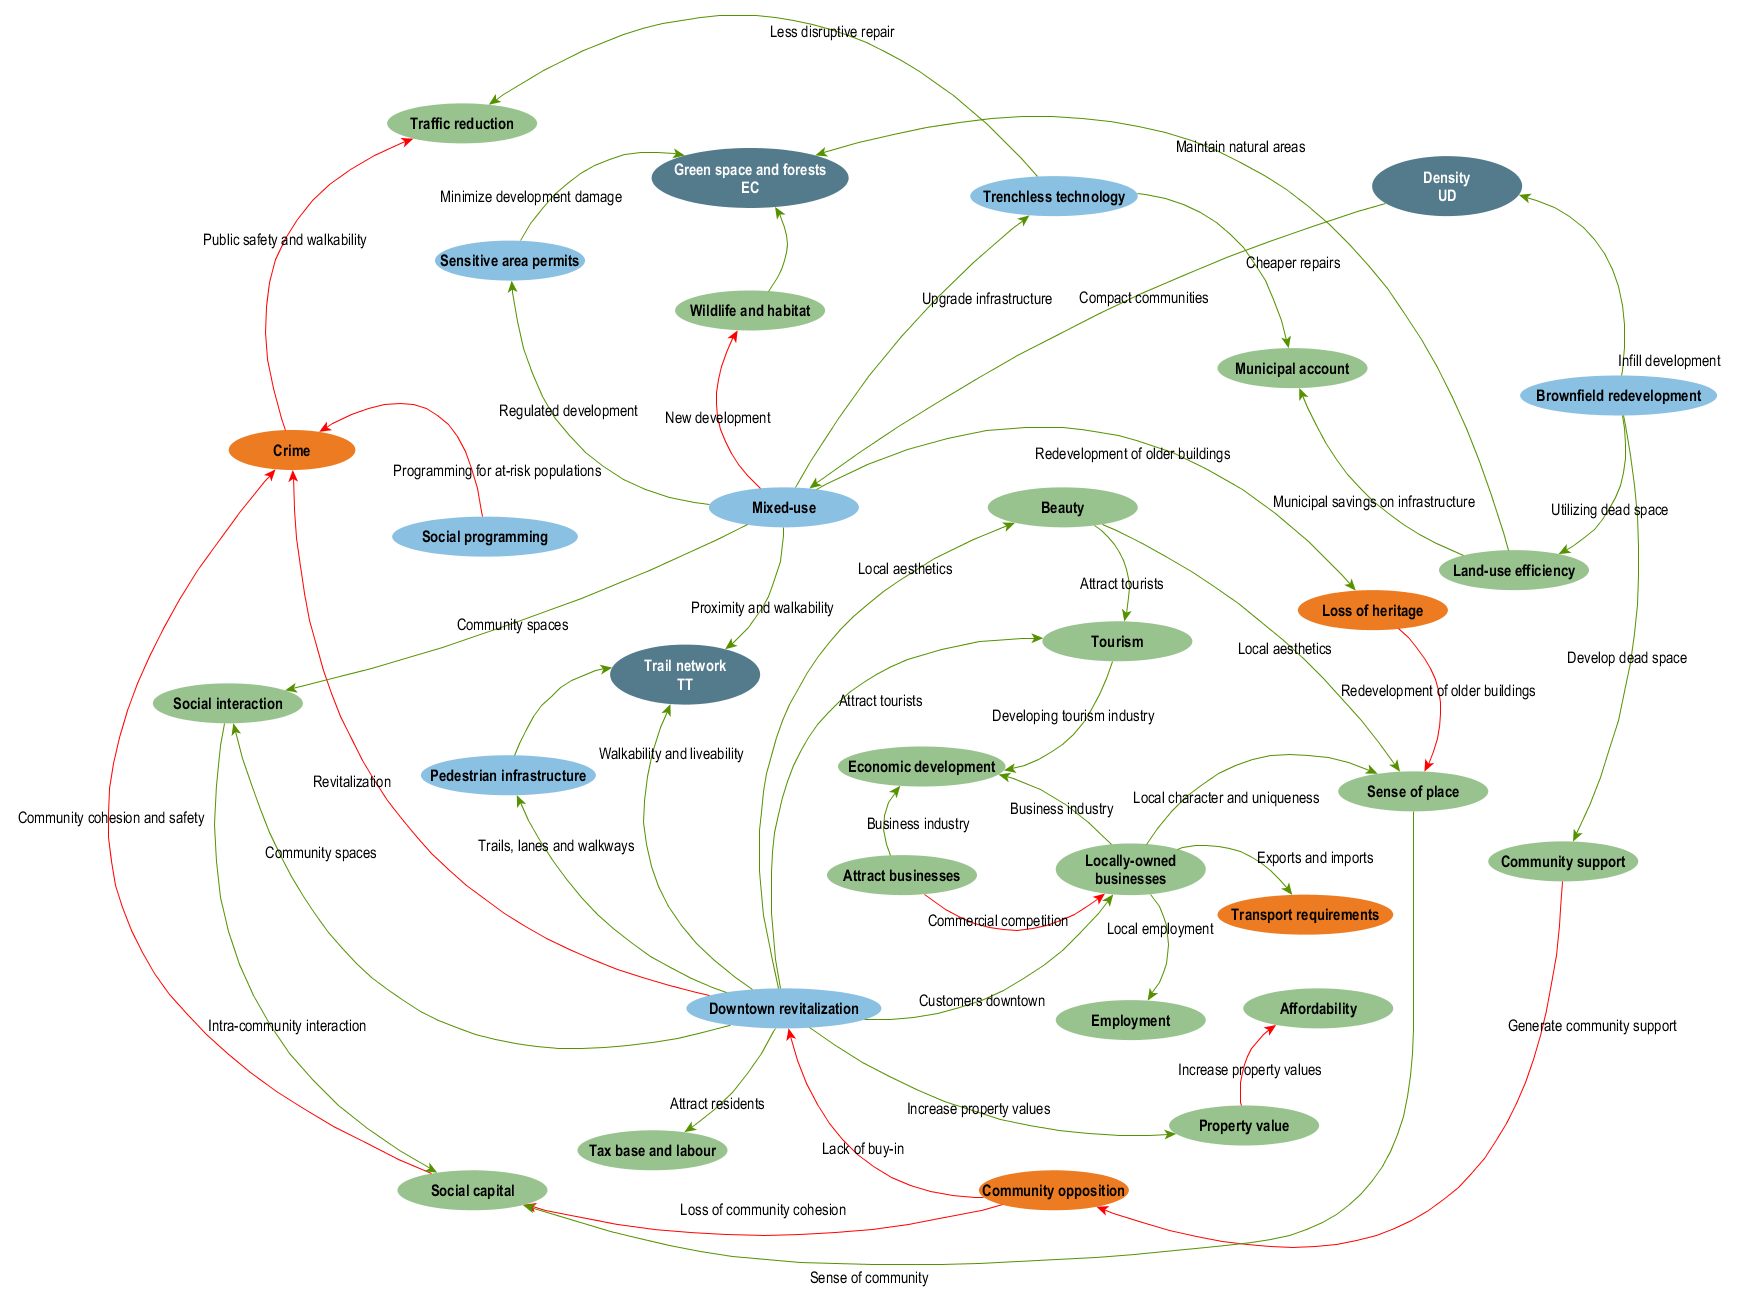 |
|
| Buildings | Mitigation through reduced energy consumption associated with green building and retrofitting strategies | 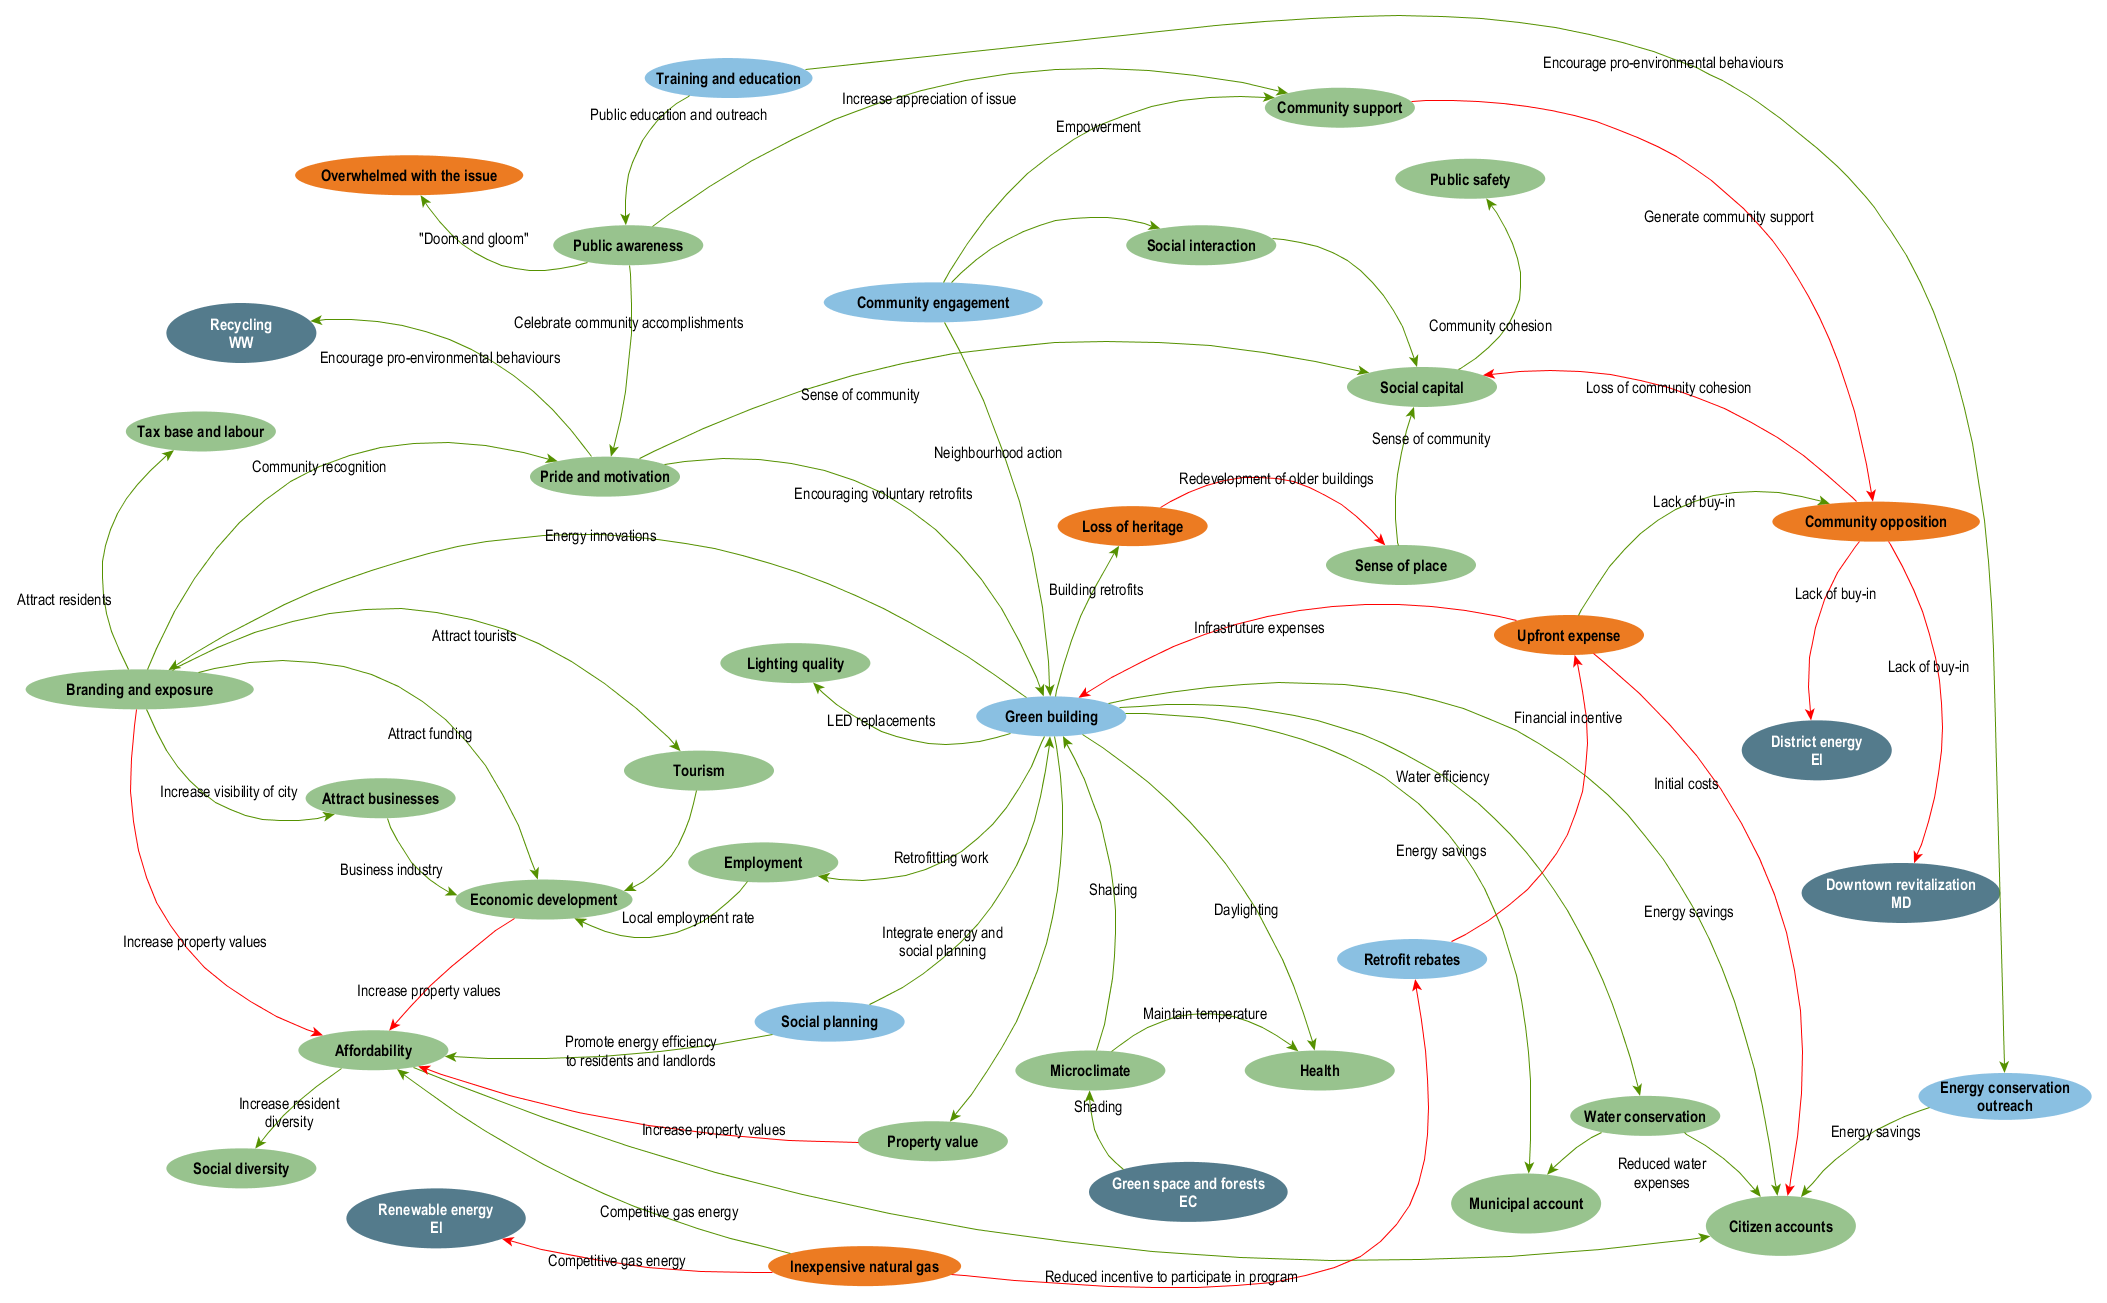 |
|
| Ecological capital | Climate mitigation benefits received from carbon sequestration, and climate adaptation benefits associated with flood control and temperature regulation | 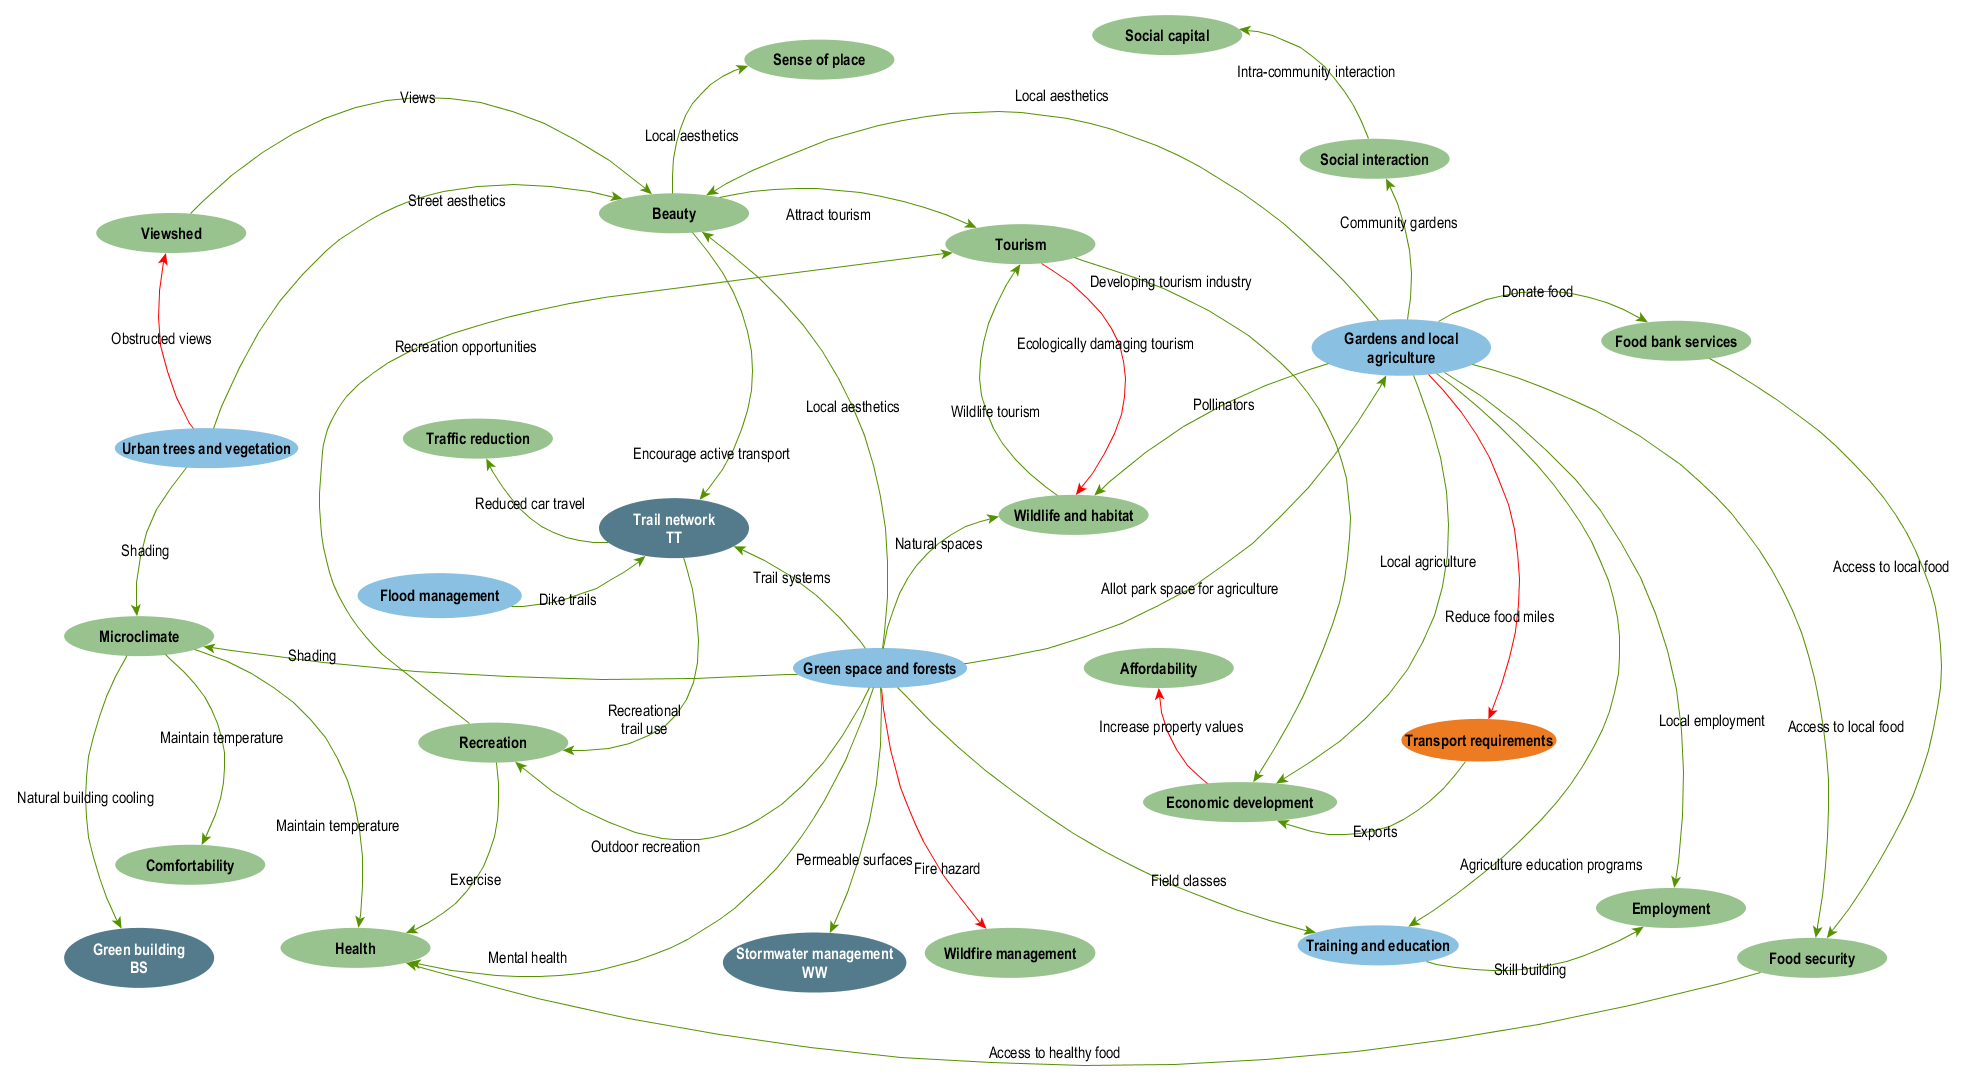 |
|
| Trails and transportation | Climate mitigation strategies centered on reducing vehicle traffic | ||
| Waste and water | Mitigation benefits related to waste diversion, and adaptation strategies such as stormwater and flood management |
|
|
|
Newell, R., and Jost, F. (2018). Mapping climate action co-benefits and decomposition of local and regional greenhouse gas emissions [presentation]. Presented in Co-benefits and Integrated Planning: City of Vancouver Lunch-and-Learn, February 13, 2019. Vancouver, British Columbia |
|
|
Newell, R. (2018). Mapping climate action co-benefits and decomposition of local and regional greenhouse gas emissions [video]. Presented in the 2018 MC3 Learning Exchange, October 18, 2018. Prince George, British Columbia |
|
|
Newell, R, and Dale, A. (2018). Climate action co-benefits and integrated community planning: Uncovering the synergies and trade-offs [presentation]. In The Tenth International Conference on Climate Change: Impacts & Responses, April 20-21, 2018. Berkeley, California. |
|
|
Newell, R, Dale, A. Roseland, M. (2018). Climate action co-benefits and integrated community planning: Uncovering the synergies and trade-offs. The International Journal of Climate Change: Impacts and Responses 10(4), 1-23. DOI: 10.18848/1835-7156/CGP/v10i04/1-23. |