Academic Research Curation Best Practices
| ACADEMIC RESEARCH CURATION |
| Best Practices Guide |
| Prepared by Jaime Clifton-Ross, Professor Ann Dale, and Dr. Jaigris Hodson |
This guide has been prepared by CRC Research as an outcome of the SSHRC funded research project, Research Curation: Making a Difference. This project explored how to integrate contemporary museum and social media marketing practices to enhance research dissemination and knowledge transfer between academics and wider publics. For further information, please refer to our research curation webpage.

| What is Research Curation? |
Given the spread of misinformation and the challenges in effectively circulating academic research outcomes to the general public(s), it is even more crucial for academic research to make a difference. Research curation is a method to communicate research outcomes online to diverse audiences, building upon contemporary museum practices as well as best practices in social media marketing. It combines internet communication technologies (ICT’s) with select curatorial and communication frameworks for a wider dissemination of research outcomes.
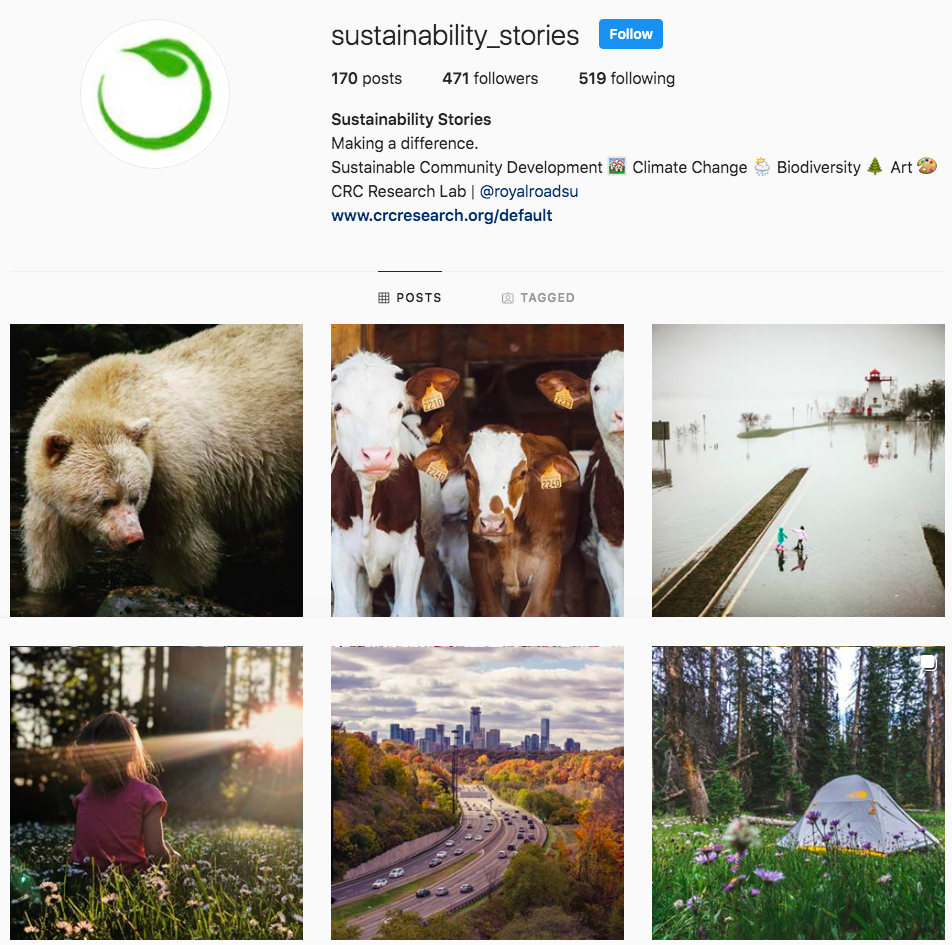
Figure 1: Sustainability Stories Instagram
| PART 1: DEVELOPING A DIGITAL COMMUNICATION STRATEGY |
Developing a digital strategy is the first step to take before initiating any web communication activities. Given how intensive social media and website management can be, it is important to plan and strategize ahead of time. This helps to identify the purpose for such activities, how it relates to your research goals, what you hope to achieve, and how you will carry them out. Through testing, research, and lessons learned, we came up with a framework for developing an effective digital communication strategy for academic research outcomes (Hodson, Dale & Clifton-Ross, 2018).
|
STEP 1 |
Audience engagement is a key factor for effective research curation and should be the first step you take when developing a digital communication strategy. To engage new audiences online, it is important to understand what information interests them, where they are located online, and which media they are attracted to. As a best practice, museums typically conduct audience research prior to curating exhibits. This helps maximize audience engagement potential as this research informs many elements in exhibits—including design, content, interpretive themes, labels, marketing, education, public programming, technology, etc. Before dedicating time and resources to communicating your research outcomes and transforming them into new media, research your target audiences. You can do this through a variety of methods, including: secondary research, surveys, questionnaires, interviews, focus groups, social media metric analysis, website metric analysis, etc. |
|
STEP 2 |
Social media content is ineffective if nobody sees it, which is why it is important to understand your target audience, identify where they are located, and how they communicate. To uncover this information, do some research to find out what platforms your target demographic is using (emarketer and Pew Research are two helpful places to go) and then make sure you spend time on the right platform listening to your community. You will see what topics they are interested in, what times they are most active, which will help you create content that resonates. |
|
STEP 3 |
Writing for social media is incredibly different than traditional academic writing. It is a more personal medium, therefore you will have a greater impact when you consider both the heart and the mind. This is especially important since people interpret information and research through personal filters which are influenced by emotions. These psychological factors help determine how they understand and use information. In museums, this concept is often referred to as ‘affect’. In order for people to connect to information, they must personally identify with it, envision themselves within it, or be moved by it. |
|
STEP 4 |
As social media increasingly becomes a ‘walled garden’, one way to resonate with your audience is by personalizing your research. Putting a face behind the name, so to speak, can help make your content more engaging and impactful. For example, speak to your audience directly in blog posts, share a selfie in your work space, or discuss a research finding in an Instagram story or video. |
|
STEP 5 |
Many research subjects, such as environmental issues, are framed through doom and gloom messaging. While shock value can be an effective tool for surface engagement, sharing innovative stories, research progress, or solutions-based content can help differentiate your content. We successfully increased the size and diversity of our audience by focusing on positive and helpful messaging. Whenever we identify a problem, we also identify solutions or local, national, and international innovations. |
|
STEP 6 |
Create online content that is engaging, topical, and entertaining. Consider using trending hashtags, creating memes or GIFs, or inserting humour into your content. |
|
STEP 7 |
Integrate images, videos, art, data visualizations, music, or GIF’s when developing social media and website content. This will help capture your audience’s attention in their busy social media feeds, make your content more memorable, and insert a performative element. Furthermore, visuals can communicate large amounts of information in a small space. |
|
STEP 8 |
To engage a diversity of users online, it is important to offer multiple points of entry. Since some people are drawn to videos and data visualizations while others prefer peer-reviewed journal articles and reports, consider presenting your research outcomes through a variety of media. |
|
STEP 9 |
Ensure your content provides added value and breaks through information overload. It is not enough to simply share links; content curation must provide additional insight and commentary on the content at hand. |
|
STEP 10 |
The content you share should help build trust with your audience. Maintain a consistent content schedule and curate only reliable and high-quality content. Consider following other substantive users, highlighting their work in blogs posts or news features, or like and retweet/share their posts. |
|
|


| PART 2: DEVELOPING YOUR RESEARCH WEBSITES |
Your website is an important part of your digital toolkit. As the central hub for your communication activities, it ties together all your online communication initiatives. Consider using your website to host your blog, outline your research projects, share research updates, archive your publications, profile yourself and/or your research team, and/or lead virtual conversations. For an example of this, please refer our e-Dialogue platform, Changing the Conversation. Incorporating a striking design, using clear language, and following usability and information design best practices are key to building a successful website. If you are not experienced with web design or do not have the funds to hire a web designer, consider using a pre-designed, more user-friendly content management system (CMS) template as they are typically built to adhere to core web design best practices (i.e. WordPress and Squarespace). It is incredibly important that your website meets accessibility standards and web safe best practices. Therefore, consult W3C web accessibility standards to ensure your website provides equal access and opportunity to diverse audiences.
To track engagement and general website metrics, consider installing Google Analytics on your website. This will provide more in-depth data such as traffic sources, user behaviour, demographic information, and pageview numbers. While built-in website analytics on Squarespace or WordPress are informative, Google Analytics’ customizable interface provides deeper insight on trends.
| Website Design |
The design of your website is arguably as important as your content. Since the average user spends less than 15 seconds on a webpage, it must immediately grab their attention and maintain it. Leonardo DaVinci is famously credited with stating that “art is the queen of all sciences communicating knowledge to all the generations of the world.” This quote still rings true today as your website aesthetics will enhance the communication of your research.
| ACCESSIBILITY |
Ensure fonts, font sizes, font colours as well as your website colour palette and contrast meet web accessibility standards. Refer to W3C web accessibility standards. |
| VISUALS |
Make use of images, videos, and embeddable data visualizations to break up the text on your website and to communicate your research in a different way. Describe your images through alt tags to ensure accessibility. |
| ART |
Consider integrating art and high-resolution photographs throughout your website or within the text of your webpages. This will help make your website more aesthetically pleasing and topical to diverse audiences. |
| LOGO |
Create a logo and other visuals to brand your work. This will help establish identifying symbols and visual consistency online. |
| CONSISTENCY |
Ensure your website uses a consistent and accessible colour palette. |
| WHITE SPACE |
Your website should never take away from your content, rather it should enhance it (think white gallery walls and artworks). Use white space. |
| TEXT LENGTH |
Include only high-level text on static pages (i.e. about page). Use hyperlinks or additional webpages to outline more in-depth details. |
| RESPONSIVE |
Ensure your website is responsive (mobile friendly) so it is accessible from a variety of devices (desktops, laptops, tablets, and mobile phones). |
| TRENDS |
Avoid getting caught up with unsustainable design trends. Clean and simple design will stand the test of time. |
| 'Skim, Swim, Dive' Content Framework |
Many academics worry that simplifying their research outcomes for tweets, blogs posts, or short videos can potentially distort or weaken their work. The ‘Skim, Swim, Dive’ framework provides a great content structure to address these concerns. Developed by Charlotte Sexton, the former Digital Media head at The National Gallery in London, UK, information can be structured around the ways different users interact with web content. This user-friendly framework structures web content into three levels of engagement: ‘skim’, ‘swim’, ‘dive’. The goal is to create enticing content that maintains the attention of users while encouraging them to dive deeper into the subject. This helps increase their understanding of your research outcomes while giving them access to additional resources. The application of ‘skim, swim, dive’, however, will vary depending on the type of content. We applied the ‘skim, swim, dive’ framework to our promotional webpages for our biodiversity conversation series.
| SKIM | SWIM | DIVE | |||
| DESCRIPTION |
This level caters to users who prefer high-level information or a synopsis, and simply want to learn the essentials—the ‘what’, ‘why’, ‘where’, and ‘how’. |
This level offers additional information that goes beyond a synopsis. This can appear in the form of blog posts, high-level reports, news articles, or videos. |
This level offers in-depth information such as peer-reviewed journal articles, detailed research reports, and scientific datasets. | ||
| EXAMPLES |
High-level information, such as a description of the conversation series and key connection details while underlining themes, questions, and goals for the event. |
A series of hyperlinks that redirected to webpages that featured headshots and bios of panelists, information about our partner organizations, as well as a Living Planet report. |
Links to the conversation transcripts, a resource library filled with articles and reports, as well as a final action agenda outlining the findings from the series |
BEST PRACTICES
- Captions: When writing descriptive captions for videos uploaded to YouTube, Vimeo, and Facebook, include links to other relevant journal articles or reports. If users are interested in your video, then this will encourage them to dive deeper in the subject.
- Use Hyperlinks: When writing descriptive captions on your website, hyperlink to news articles, interesting websites, or open source peer-reviewed journals articles and other illustrative information.
- Embeds: Embed data visualizations or videos on webpages, in blog posts, or news updates.
- Call to Action: Encourage readers to learn more by hyperlinking to relevant resources within the body of your webpage, blog post, or news feature. Frame this as a call to action.
| 'Ideas, Objects, People' Framework |
The Ideas, Objects, People museum framework was developed by the Smithsonian Institute in 2010 and is based on visitor studies. It emphasizes the importance of curating audience-centered exhibits that consider the prior experiences and dispositions of visitors. Such considerations ultimately determine the impact exhibits have on visitors. With a goal to offer multiple points of entry, this framework structures content into three content types: ‘ideas’, ‘objects’, and ‘people’. While visitors are naturally drawn to one of the three content types, the goal of this framework is to ‘attract’, ‘engage’, and then ‘flip’ them to another element. Therefore, it is important to reformat your researching outcomes into multiple media types. In addition to curating effective research displays, this framework can be applied to website content and used collaboratively with the ‘skim, swim, dive’ framework.
| PART 3: DEVELOPING YOUR SOCIAL MEDIA STRATEGY |
Social media is a key tool for research curation. It helps extend your audience outreach and enables largescale communication. Before you tackle the social media environment, it is important to develop a strategy. Based on our experience using a range of social media channels, we developed a series of best practices to help us develop and revise our social media strategy.
| DESCRIPTION | DO'S | DON'TS | |
|
STEP 1
|
|
|
|
|
STEP 2 |
|
|
|
| STEP 3 Establish a personalized voice and tone |
|
|
|
| STEP 4 Sign up for a social media content management tool |
|
|
|
| STEP 5 Experiment with posting times |
|
|
|
| STEP 6 Set goals |
|
|
|
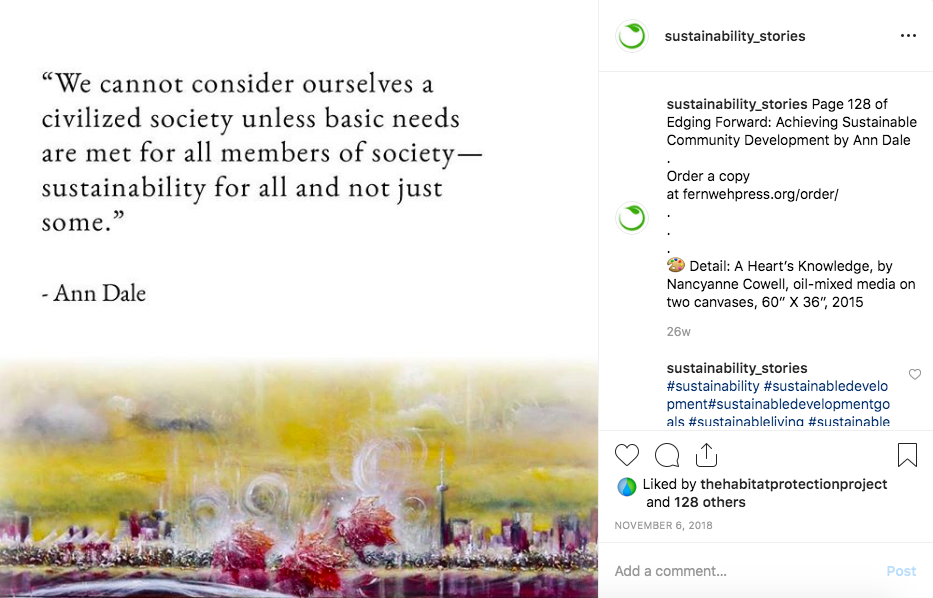
Figure 4: A promotional Instagram post integrating art, a series of researched hashtags, and a personalized tone.
| Cross-Platform Best Practices |
| DESCRIPTION | SUGGESTIONS & TIPS | EXAMPLES & RESOURCES | |
| LOGO & DESIGN |
|
|
|
|
PROFILE DESCRIPTIONS |
|
|
|
| LANGUAGE |
|
|
|
| MESSAGING |
|
|
|
| CAUTIOUSLY FOLLOW |
|
|
|
| WEBSITE CONNECTIVITY |
|
|
|
| CONTENT CURATION |
|
|
|
| SHOW SUPPORT |
|
|
|
| RECIPROCATE |
|
|
|
| TRENDS |
|
|
|
|


| Scheduling & Social Media Management |
For academics, social media is often a side of desk task, given the workload of teaching, research, community service, and administration. Furthermore, developing strategic and effective content for social media can be time consuming. To help manage this task, use a social media management tool like Buffer or Hootsuite. These tools help you cross-post between platforms and enable you to pre-schedule content up to weeks in advance. If you have a research assistant managing your social media sites, content managers enable you to review posts before they are published.
| TIPS |
|
- Repost: Given the short shelf life of social media posts, repost old content to maximize their exposure. - Scheduling: Schedule content ahead of time but leave room for last minute additions, given how quickly news stories or developments spread online. - Cater Your Copy: Always cater your written social media copy to the platform you are using. For example, write shorter copy with hashtags and mentions for Twitter. Adapt this copy for Facebook by removing hashtags, abbreviations, and mentions. |
| Personalizing Your Social Media |
The next big movement in the social media landscape is personalized engagement. Such platforms starting to privilege personal content over marketing content as users are inundated with marketing and ads. Therefore, it is important to be mindful of how you present yourself online. While some users may struggle with finding the best way forward, this development provides academics with great opportunities. When communicating your research on social media or through other online forms of media (i.e. blogs, videos, etc.), insert personal touches. Furthermore, your community may want to engage with you in non-public ways. Consider establishing communities or groups on sites like weChat, Facebook, What’s App, or SnapChat, or find out how to join established groups that benefit from your expertise.
| TIPS |
|
- Tone: Use a conversational tone in blog posts and consider sharing your personal experiences or opinions of research findings, conferences, news developments, research initiatives, etc. - Stories: Document day-to-day experiences related to your work through stories on Instagram or Facebook. - Selfies: Share the occasional selfie or group photo to remind users that there is a human behind the account. - Interact: Human to human interactions are also becoming increasingly important, therefore the ways in which you communicate with your audience is key. Engage in conversation with other users on social media. |
These strategies may ultimately help build anticipation, support, and trust in your research. If users can see a face behind the name, they may be more inclined to engage further.
For example, we have experimented with posting the same content on our research Twitter account and on our Principal Investigator’s personal Twitter account. While we received engagement on both posts, her account received significantly more despite having less followers and a less rigorous content schedule. While this is not the first time we have encountered this, it may suggest that people are more trusting of or engaged with personal accounts. While some accounts may profile an academic, others will represent a team of researchers or a research lab. If so, it is important to profile the people behind the research.
|
| PART 4: SOCIAL MEDIA LESSONS |
We use Facebook, Twitter, Instagram, Pinterest, and YouTube regularly to curate our research outcomes. We have experimented with and tested different strategies, trends, and media types for many years. However, our main takeaway is the importance of conducting audience research, continually adjusting your strategy based on which practices you find most effective, and framing your social media strategy around these findings. Based on our lessons learned, we have come up with a series of best practices for communicating academic research.
We joined Twitter in 2012 and primarily use it as a tool to disseminate our research outcomes, curate content, and to conduct social listening. It is a great platform to circulate information widely, identify hashtag communities, and speak directly to other users. Furthermore, its fast-paced nature helps illuminate topical conversations or news items.
BEST PRACTICES
| CONSISTENCY |
Ensure you post regularly however avoid posting all at once. |
| HASHTAG RESEARCH |
Use hashtags to expose yourself to a wider audience, but always investigate a hashtag before using it as you do not want to misconstrue your message. |
| NUMBER OF HASHTAGS |
Avoid overusing hashtags. When appropriate, use 1-3. |
| TRENDING HASHTAGS |
Pay attention to trending hashtags and use them strategically. |
| LISTEN |
Look for and listen to existing conversations to join as it is much easier to join a conversation than start one. |
| COMMUNITY |
Twitter is community oriented, therefore show your support by following other users as well as retweeting and liking content their content. |
| PACE |
Since Twitter moves at fast pace, reply to tweets quickly. |
| URL'S |
Since links chew up many characters, use a URL shortener. Bitly and Ow.ly are free and simple. Most social management tools provide built in shorteners. |
We joined Facebook in 2010 and primarily use it to disseminate our research outcomes, curate content, circulate videos, and run modest paid ads. Since we built up our following before Facebook made major changes to their algorithms to limit the organic reach (posting without the use of paid ads) of ‘brand’ pages, we have a modest yet consistent fan base. Despite this limitation, we have learned that consistent and strategic scheduling will ensure that your posts reach a subset of your following. We also use paid ads (typically under $25) to promote new articles, videos, reports, etc. This not only helps us break through our filter bubble, but also provides us with a new subset of data. However, it is important to consider privacy concerns and data collection prior to joining this platform.
BEST PRACTICES
| FREQUENCY |
Less is often more when it comes to Facebook, therefore we suggest you post consistently but not as frequently as Twitter. |
| VIDEOS |
Use Facebook as an additional video hosting site. In addition to YouTube or Vimeo, upload your videos to your Facebook video playlist. This will help circulate your videos to a wider audience as Facebook privileges this content type. Simply sharing your video from YouTube or Vimeo on to Facebook will limit its reach. |
| PAID ADS |
With the introduction and constant evolution of algorithms, you can only engage so many users through organic reach. Schedule affordable paid ads (under $25) to promote new publications, videos, reports, data visualizations, or upcoming events to thousands of potential users. |
| FACEBOOK GROUPS |
Consider joining or starting a Facebook group. This will help you find like-minded users and provide you with an existing space to share content and engage in dialogue. |
| HASHTAGS |
Avoid using hashtags on Facebook. |
| QUOTES |
Since Facebook allows for lengthier posts than Twitter, consider sharing quotes from articles. |
We joined Instagram in 2017 to test how images can be used to communicate academic research. As an incredibly powerful and popular platform, it boasts 1 billion users worldwide and has a wide reach. It is, however, very different from Twitter and Facebook. As it is an image-based platform, you cannot share links unless you have thousands of followers, which is why you need to harness the power of visuals in combination with hashtags. Instagram is owned by Facebook, therefore you should consider privacy and data usage prior to opening an account.
BEST PRACTICES
| QUALITY |
Post only high-quality images, videos, or stories. |
| RESEARCH |
Research appropriate hashtags. Avoid using hashtags that are not relevant to your content. |
| HASHTAGS |
You can use up to 30 hashtags for each post to maximize reach. Do not use the same hashtags multiple times in a row as Instagram algorithms may think you are spamming the feeds. Post hashtags as a comment to avoid using up the caption character count. |
| SHADOWBAN |
Instagram will limit the reach of your content if you do not follow their community rules. Only post open-source or creative commons images or get permission to use images or artworks. Avoid the use of bots to comment and like other user content, vary your hashtag use, and avoid using third-party apps to post on Instagram. |
| LINKS |
If you want to share a link, paste it into your account description and direct to your profile. |
| STORYTELLING |
Use a narrative framework when writing captions. Consider posting abbreviated versions of your blog content. |
| MICROBLOGGING |
It is difficult to boil down academic research outcomes into short excerpts. Treat Instagram like your blog. Experiment with different description lengths and styles. |
| VIDEOS |
Ensure all videos are 60 seconds or less. |
| STORIES |
Harness the power of Instagram stories. Use stories to talk about your research outcomes as this will help personalize your research and put a face behind the work. |
As an image-based platform, our Pinterest account helps us establish a visual footprint online by integrating our pins into image searches via Google, Bing, Duck Duck Go, etc. It is a relatively low-maintenance platform as pins continue to generate engagement with little work. We joined Pinterest in 2016 and use our boards as visual collages linking to saved resources—including articles, videos, reports, art projects, etc. We also use it as a tool for classroom engagement. Consider creating a collaborative board that functions as a library for students to share ideas and resources. See Sustainability Studio: Poetry in Motion as an example of a collaborative student board.
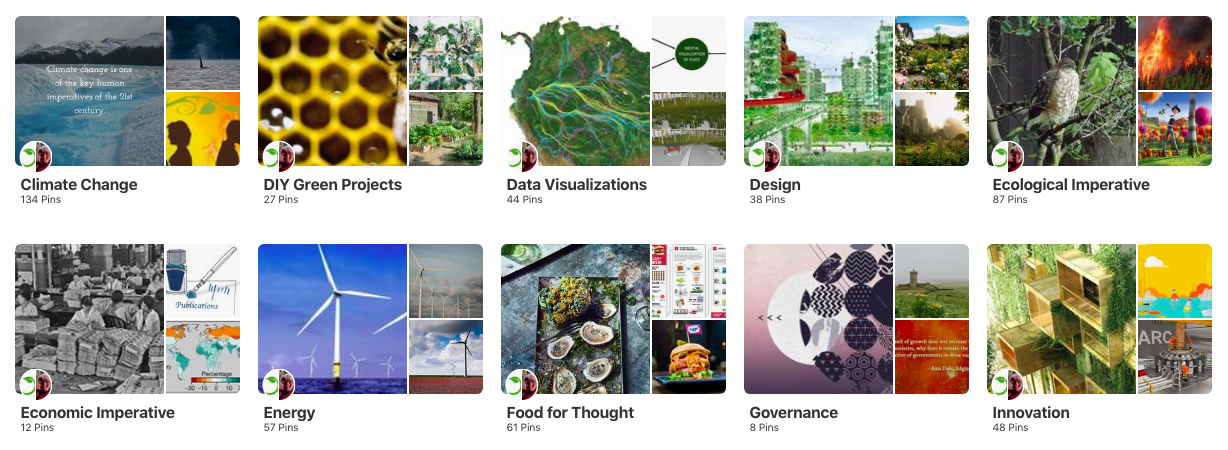
Figure 8: CRC Research’s Pinterest profile
BEST PRACTICES
| PIN SOURCE |
Pin images from your website to ensure connectivity. |
| VERIFY |
Verify your website on Pinterest to ensure it collects analytics. |
| BOARD CATEGORIES |
Give your boards topical titles based on Pinterest search terms to make them more discoverable. |
| DESCRIPTIONS |
Write pin descriptions that are 200 words or less and include keywords. |
| BE SOCIAL |
Engage with others by following their boards and saving their pins. |
| WEBSITE EMBEDS |
Embed Pinterest boards on webpages to help direct users to your Pinterest account and to act as a visually engaging form of media. |
| BROWSER BUTTON |
Install the browser button on your website to encourage users to share images. |
| YouTube |
We joined YouTube in 2011 and named our channel HEADTalks (Humanities, Education, and Design). Our goal was to experiment with social media for research dissemination and to present our research outcomes in a different format. While YouTube best practices have changed considerably over the years, our main strategy is to personalize our research and to make complex ideas more understandable. Furthermore, we add a level of creative depth to our research through animation. For detailed best practices, visit Hootsuite’s complete guide to YouTube.
Videos have become increasingly vital for social media communications. When done well, they are highly engaging, easy to absorb, and are a great medium to harness the power of storytelling. With many different creative directions to take, videos can communicate research using art, music, visualizations, animations, and footage—see our video What is Spatial Justice? as an example. YouTube (and other video platforms) helps circulate video content and generates embeddable links that make it easy to share on website(s).
BEST PRACTICES
| THE SHORTER THE BETTER |
Keep your videos under 1-3 minutes to optimize engagement. If you are posting it on Instagram, ensure you make it 60 seconds or less. See What are the co-benefits of climate action? as an example. |
| GET TO THE POINT |
Make sure the first 10 seconds are captivating. Your viewers may not watch the full video as attention spans online are short, therefore use the first few seconds wisely. |
| HIGH LEVEL |
Keep information high level. Don’t get into the nitty, gritty details. Encourage viewers to learn more by clicking on a hyperlink in the video caption. |
| QUALITY |
Ensure footage, images and sound are high quality, since viewers tend to navigate away from poor quality videos whether the content is of interest or not. |
| STORYTELLING |
Tell a compelling story in your video. This helps viewers relate to your content by eliciting an emotional response. |
| VISUALS |
Use captivating visuals or even consider collaborating with an artist. |
| IMAGE USE |
Ensure any images you use are open source, licensed, or that you have received written approval for use. If the license requires recognition of the creator, include these details in the end credits. |
| SUBTITLES |
Subtitles help viewers who have hearing loss, are hearing impaired, and whose second language is English. Furthermore, they make videos easier to follow, which is especially important when presenting academic research. |
| CALL TO ACTION |
Include a call to action at the end of the video. Since you are promoting your research, encourage viewers to learn more about your information by clicking on a link. |
| EMBED |
Embed your videos on your website. This will enhance your webpage content while encouraging users to visit your YouTube Channel. |
| CROSS-PROMOTION |
Promote your YouTube channel on other social media platforms. This will encourage users to visit your channel. |
| PART 5: REFORMATTING YOUR RESEARCH OUTCOMES |
Publishing peer-reviewed journals and research reports are integral to the research dissemination process; however, these resources are often inaccessible and unknown to the wider public(s). While it is important to continue to share such publications on your social media channels, there are many other mediums that are more engaging and user-friendly for the public.
Given the volume of information available online, it is important to create a smoke signal around your research. Presenting your research using a diversity of formats will help make it more discoverable. While some people enjoy short, high-level videos, others prefer in-depth data visualizations. Therefore, reformatting your research outcomes helps offer multiple points of entry for a diversity of audiences.
Reformatted media: videos, blog posts, data visualizations, music, art, video games, podcasts, and displays or exhibits.
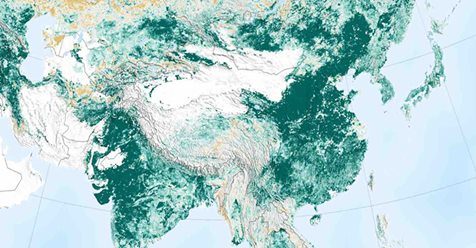
Figure 9: A picture of electrical energy use in Canada data visualization
| Data Visualizations |
Data visualizations are a great way to present data in a visual format. From GIFs, interactive animation (likely using HTML 5), and video games to maps, charts, and graphs, they come in many different shapes and forms. We have compiled a set of general best practices that we follow when creating data visualizations.
| DESCRIPTION | EXAMPLES | |
| AESTHETICS & DESIGN |
It is important to make visualizations attractive and topical to effectively communicate your data. Be mindful of design best practices as aesthetics play a key role in attracting audiences and maintaining their interest. |
Forget the Snowy Winters of Your Childhood by Naël Shiab |
| COLLABORATION |
Collaborating with artists or designers to develop data visualizations will help make them more engaging to users. Since artists can potentially help audiences engage with your data or research on a more visceral level, invite them to collaborate with you throughout your research process rather than working independently. |
The Shape of Change by Val Britton |
| CLARITY & READABILITY |
Clarity in design is closely related to aesthetics. When developing a visualization, it is important to consider whether design elements or artistic features are adding to or detracting from its clarity. Ensure that one element is not privileged over the other. Furthermore, it is important for users to be able to understand data at a glance. |
Climate Spirals by Ed Hawkins |
| INTERACTIVITY |
Interactivity is a key feature in data visualizations. Clickable content and the ability to trigger animations, for example, can help visualizations engage and maintain user interest. While static visualizations are inherently important when communicating data to specialists, interactive visualizations are best suited for general audiences. |
Art, Aesthetics & Making the World a Better Place Map by Changing the Conversation |
| COMPLEMENTARY |
One visualization format is not necessarily better than another, especially since audiences are drawn to different media types. Therefore, your communication strategy should present multiple types of visualizations in a complementary fashion. For example, when designing an interactive visualization, include a link to time-series graphs plotting your research trends. |
A Picture of Electrical Energy Use in Canada by MC3: Meeting the Climate Change Challenge |
| Blogs |
Blogs are a great way to quickly publish your research outcomes using a more casual tone. They help assert the relevance of academic research online (when following best web practices), encourage academics to reflect on and communicate their outcomes throughout the research process, and feed regular content to social media channels. They also give academics the opportunity to circulate accurate, reliable, and trustworthy information in an online climate that is highly susceptible to misinformation and ideological trolling. They are the perfect platform to embed or hyperlink to important resources and references. Furthermore, blogs can engage readers early in the research process, which helps build anticipation of final results.
Another benefit of blogs is their ability to reach new audiences or audiences who do not generally gravitate towards or have access to peer reviewed journals. They can help humanize the research process by putting a face behind the page, so to speak, making it easier for audiences to connect to academics. Furthermore, our research shows that students with an above average level of knowledge on social and environmental issues read blogs regularly (Dale et al., forthcoming). This is a medium that will help you assert your ideas online while enhancing public access to your knowledge.
BEST PRACTICES
| WRITING STYLE |
To ensure your writing is accessible, use plain language and avoid using academic jargon. Adopt the museum method of writing at a grade five reading level to ensure audiences with different reading levels and language abilities can understand your work. Also, keep your sentences short. |
| STORYTELLING |
Blog posts are often casual in tone, so presenting your research outcomes using a narrative framework is a great way to liven up your work. This will not only help personalize your post but also give your writing more energy. Think of it like having a conversation with your readers. |
| LENGTH |
Save the lengthy writing for your peer-reviewed journal articles and reports. Our research shows that readers ages 18-34 prefer 1-3 paragraphs, so try to limit your average post to 500 words or less (Dale et al., forthcoming). |
| POST TYPE |
Write a variety of post types including: short reflections; research updates; in-depth articles (only occasionally); interview highlights (if given permission to publish); media embeds with short description (videos, data visualizations, etc.), announcements; news; etc. |
| MEDIA |
Include one or more images, videos, data visualizations, audio files, podcasts, GIFs, etc. in your blog posts. This will help break up the text and include different content types that will help communicate and support your ideas. |
| HYPERLINKS |
Link to outside sources such as reports and datasets, rather than digressing with in-depth explanations (unless that is what your post is centred on). For example, when referencing ideas or statements from reports, make sure you provide a link to the report and encourage your readers to explore it further. |
| TITLE |
Use descriptive and thought-provoking titles. This is what will appear in social media previews, so it is important to grab your reader’s attention. |
| INTRODUCTION |
Grab your reader’s attention in the first sentence and/or paragraph as the average time spent on a single webpage is less than 15 seconds. |
| BACK END DETAILS |
Do the work for your readers. Insert social media copy promoting your blog post in the ‘alt tag’ of the image. This will help index it in image searches and will auto-generate text when shared by other users on social media. |
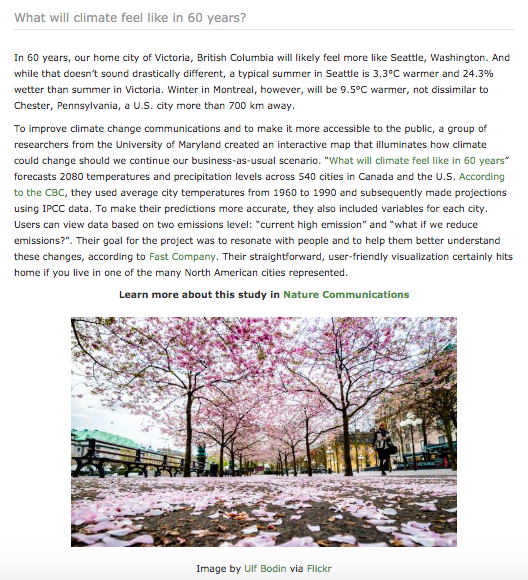
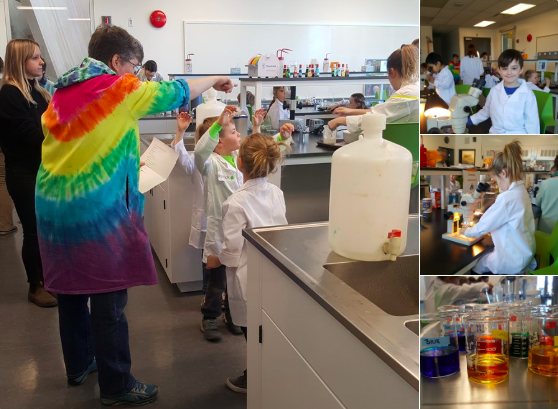
Figure 10: A CRC Research blog post outlining a recent climate change study.
| Real-Time Conversations |
We have experimented with leading real-time, virtual conversation for many years using our e-Dialogue platform, Changing the Conversation. As a simple text-based discussion forum, this communication channel hosts conversations about a variety of topics to help rethink and reframe modern day challenges. As a democratic, intergenerational and inclusive platform, it helps bridge the divide between academics, practitioners, decision-makers, and the public. This type of forum is a great way to collect data, bring together experts, publicly share ideas, or to collect data through a virtual focus group. They are less pressure than panel discussions and they offset the financial and environmental costs of meeting in person. Furthermore, they generate transcripts that are great for data analysis as they are a text-based medium.
BEST PRACTICES
| MODERATION |
To ensure conversations are civil, respectful, and productive, moderate the conversations (like a panel discussion moderator). |
| SCRIPTING |
Prepare questions ahead of time and send them to your panelists. This will give them time to prepare their answers and ensure their ideas are more thoughtful. |
| PERSONALIZE |
Address your panelists by name and call on them to clarify or elaborate on ideas. |
| RESOURCE SHARING |
Encourage your panelists to share resources and links during conversations. |
| AUDIENCE |
Interact with the audience and invite them to ask questions. |
| TRANSCRIPTS |
Make transcripts available for download on your website following the conversation. |
| ANALYSIS |
Analyze conversation transcripts and use the data collected for research and publications. |
| COLLABORATION |
Collaborate with other researchers or organizations to ensure diverse voices are included. |
| Research Exhibits |
Curating exhibits or displays are a great way to share your research with the public. As a physical presentation of your work, they have a lot of engagement potential. We have curated two exhibits, including Edging Forward: Reconnection, Reconciliation, Regeneration and Sustainable Communities: Making a Difference (digital exhibit coming soon). The former displayed largescale oil paintings and literary interpretations while the latter highlighted a eight research projects from our catalogue. While we used the Ideas, Objects, People and Skim, Swim, Dive frameworks to develop our exhibits, we discovered a series of best practices through lessons learned.
BEST PRACTICES
| AUDIENCE RESEARCH |
Conduct audience research prior to developing an exhibit. It is important to know who will be visiting your exhibit (scientists, students, the public, etc.) as this will help you frame the interpretive style and tone of your content. This will also help you determine what elements to feature (i.e. images, videos, technology, text panels, etc.). |
| LESS IS MORE |
Avoid information overload. Feature the most interesting aspects of your research and direct visitors to your website for additional information. |
| STORYTELLING |
Frame your research through a narrative. |
| THEMES |
Frame your research through themes. |
| LABELS |
Write labels at a grade 5 reading level. |
| VISUALS |
Integrate high quality visuals into your exhibit, including art, photographs, animations, or design elements. |
| TECHNOLOGY |
Be strategic with tablets and other interactive features. Only use technology if it enhances your content. |
| COHESION |
Ensure there is cohesion between display elements. |


